Advanced plotting
- Moving to object-based plotting
- Figure size
- Placing Axes
- Twin axes
- Controlling the appearance of plots
- rc parameters
- Adding a legend
- Adding a colorbar
- Custom ticks and labels
- Artists, Patches, and Lines
stackoverflow
How do I draw a grid onto a plot in Python? [closed]
Set figure object to bounding box of fig.get_tightbbox()
Definition of matplotlib.pyplot.axes.bbox
Backend
Usage Guide – Backends
matplotlib.use required before other imports clashes with pep8. Ignore or fix?
import matplotlib
matplotlib.use('GTK3Cairo')  # noqa
import matplotlib.pyplot as plt
TkCairo
GTK3Agg
GTK3Cairo
ValueError: Unrecognized backend string 'gtk': valid strings are
['GTK3Agg', 'GTK3Cairo', 'MacOSX', 'nbAgg', 'Qt4Agg', 'Qt4Cairo',
 'Qt5Agg', 'Qt5Cairo', 'TkAgg', 'TkCairo', 'WebAgg', 'WX', 'WXAgg',
 'WXCairo', 'agg', 'cairo', 'pdf', 'pgf', 'ps', 'svg', 'template']
LaTex
$ sudo apt-get install texlive texlive-lang-german texlive-latex-extra
$ sudo apt-get install dvipng
$ sudo apt-get install ghostscript-x
Text rendering With LaTeX
Text rendering With LaTeX
How do I write a Latex formula in the legend of a plot using Matplotlib inside a .py file?
Text rendering with LaTeX
Rendering math equations using TeX
\displaystyle
\displaystyle
works: GTK3Agg
doesn't work: GTK3Cairo, TkCairo
Convert to PostScript / PDF
Poppler, a PDF rendering library
Xpdf, an open source viewer for Portable Document Format (PDF) files
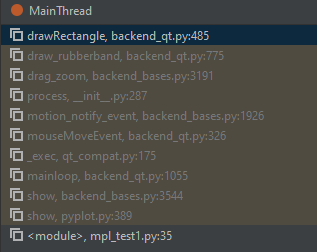
Zoom
class FigureManagerQT(FigureManagerBase):
    def __init__(self, canvas, num):
        self.window = MainWindow()
        super().__init__(canvas, num)
        self.window.closing.connect(canvas.close_event)
        self.window.closing.connect(self._widgetclosed)

        image = str(cbook._get_data_path('images/matplotlib.svg'))
        self.window.setWindowIcon(QtGui.QIcon(image))

        self.window._destroying = False

        self.toolbar = self._get_toolbar(self.canvas, self.window)
        self.window.setCentralWidget(self.canvas)

        # [...]

        if self.toolbar:
            self.window.addToolBar(self.toolbar)
            tbs_height = self.toolbar.sizeHint().height()

    def _get_toolbar(self, canvas, parent):
        # must be inited after the window, drawingArea and figure
        # attrs are set
        if mpl.rcParams['toolbar'] == 'toolbar2':
            toolbar = NavigationToolbar2QT(canvas, parent, True)
        elif mpl.rcParams['toolbar'] == 'toolmanager':
            toolbar = ToolbarQt(self.toolmanager, self.window)
        else:
            toolbar = None
        return toolbar

class NavigationToolbar2QT(NavigationToolbar2, QtWidgets.QToolBar):
    def __init__(self, canvas, parent, coordinates=True):
        # [...]
        for text, tooltip_text, image_file, callback in self.toolitems:
            if text is None:
                self.addSeparator()
            else:
                a = self.addAction(self._icon(image_file + '.png'),
                                   text, getattr(self, callback))
                self._actions[callback] = a
                if callback in ['zoom', 'pan']:
                    a.setCheckable(True)
                if tooltip_text is not None:
                    a.setToolTip(tooltip_text)
        # [...]
    def drawRectangle(self, rect):
        # Draw the zoom rectangle to the QPainter.  _draw_rect_callback needs
        # to be called at the end of paintEvent.


# Toolbar Zoom Button Click
class NavigationToolbar2QT(NavigationToolbar2, QtWidgets.QToolBar):
    [...]
    def zoom(self, *args):
        super().zoom(*args)
        self._update_buttons_checked()
    [...]
 |
Tooltip / Annotation
Tooltips with Python’s Matplotlib
How to add hovering annotations to a plot
Pick Event
click data on/off in legend python scatterplot
Is it possible to use matplotlib legend picker selecting legend text area not legend line?
matplotlib — interactively select points or locations?
Legend Picking
Pick Event Demo